
Drone, gis, & construction services
A clearer view of your site.
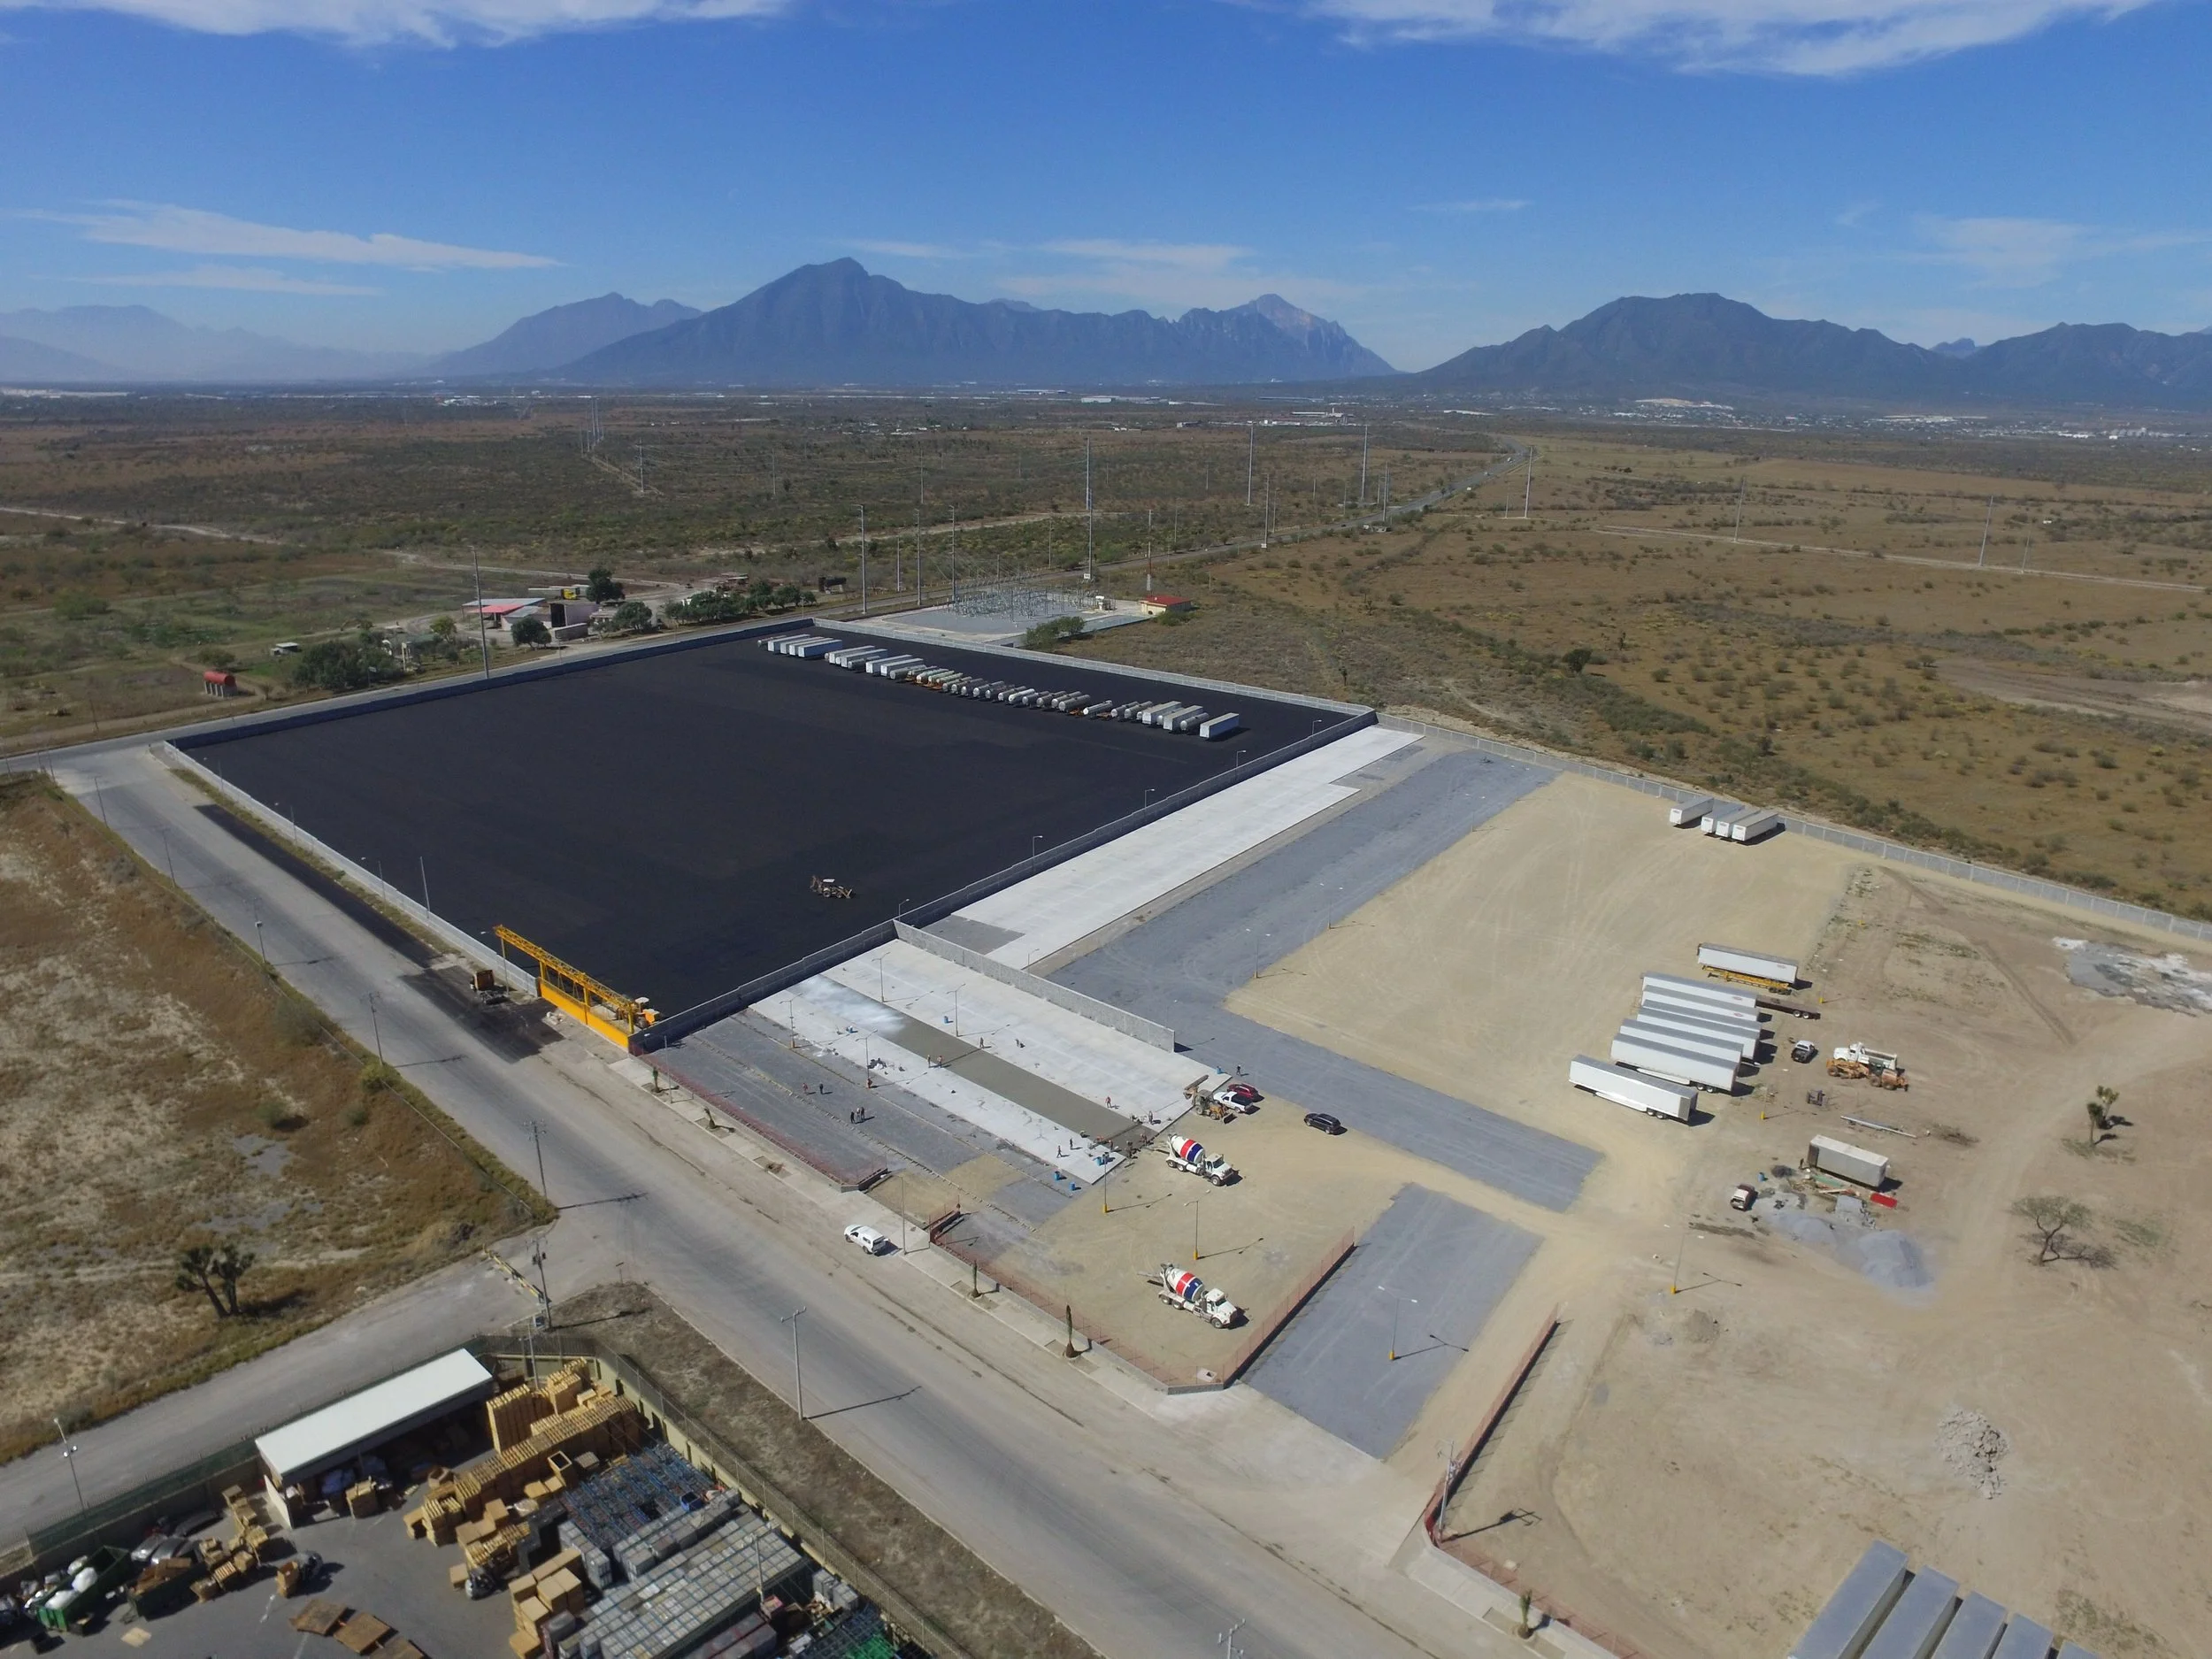
G.O. Summit provides drone mapping, GIS, thermal imaging, and site documentation for construction, development, and land-based projects.
We help turn site conditions into clear visuals, maps, and data that are easier to understand, share, and use.

our core services
GIS & Drone mapping
Get a better understanding of your entire site with aerial imagery and GIS mapping.
GIS & Drone mapping
Keep a clear record of your project as it changes over time.
Progress Imagery - Existing Conditions
Site Overviews - Project Updates
Before & After
Site Mapping - GIS - Orthomosaic Imagery
Spatial Data - Site Visualization
GIS & Drone mapping
See information that regular photography cannot.
Thermal Imaging - Technical Verification
Environmental Data - Site Analysis
See the site as more than a photograph.
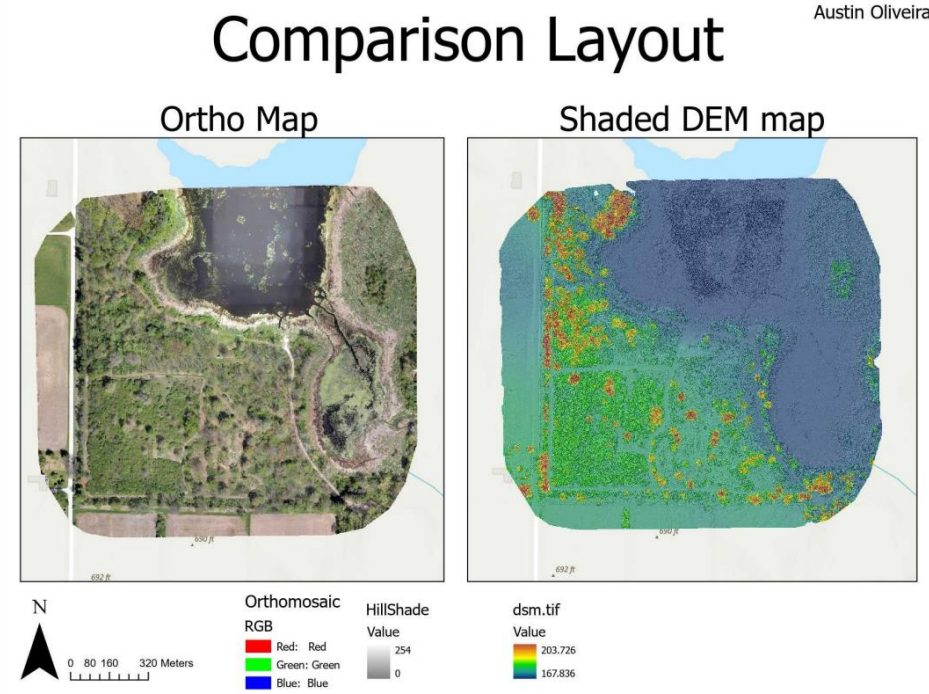
Drone mapping allows us to capture large areas from above, while GIS helps organize that information into clear maps and useful spatial data. These tools can help clients better understand site conditions, document properties, and communicate project information.
gis & drone mapping
Service 01
COMMON USES
Site and property mapping
Construction site visualization
Land and developement documentation
Spatial data visualization
Existing-condition mapping
Project planning support
Construction documentation
Document the project from start to finish.
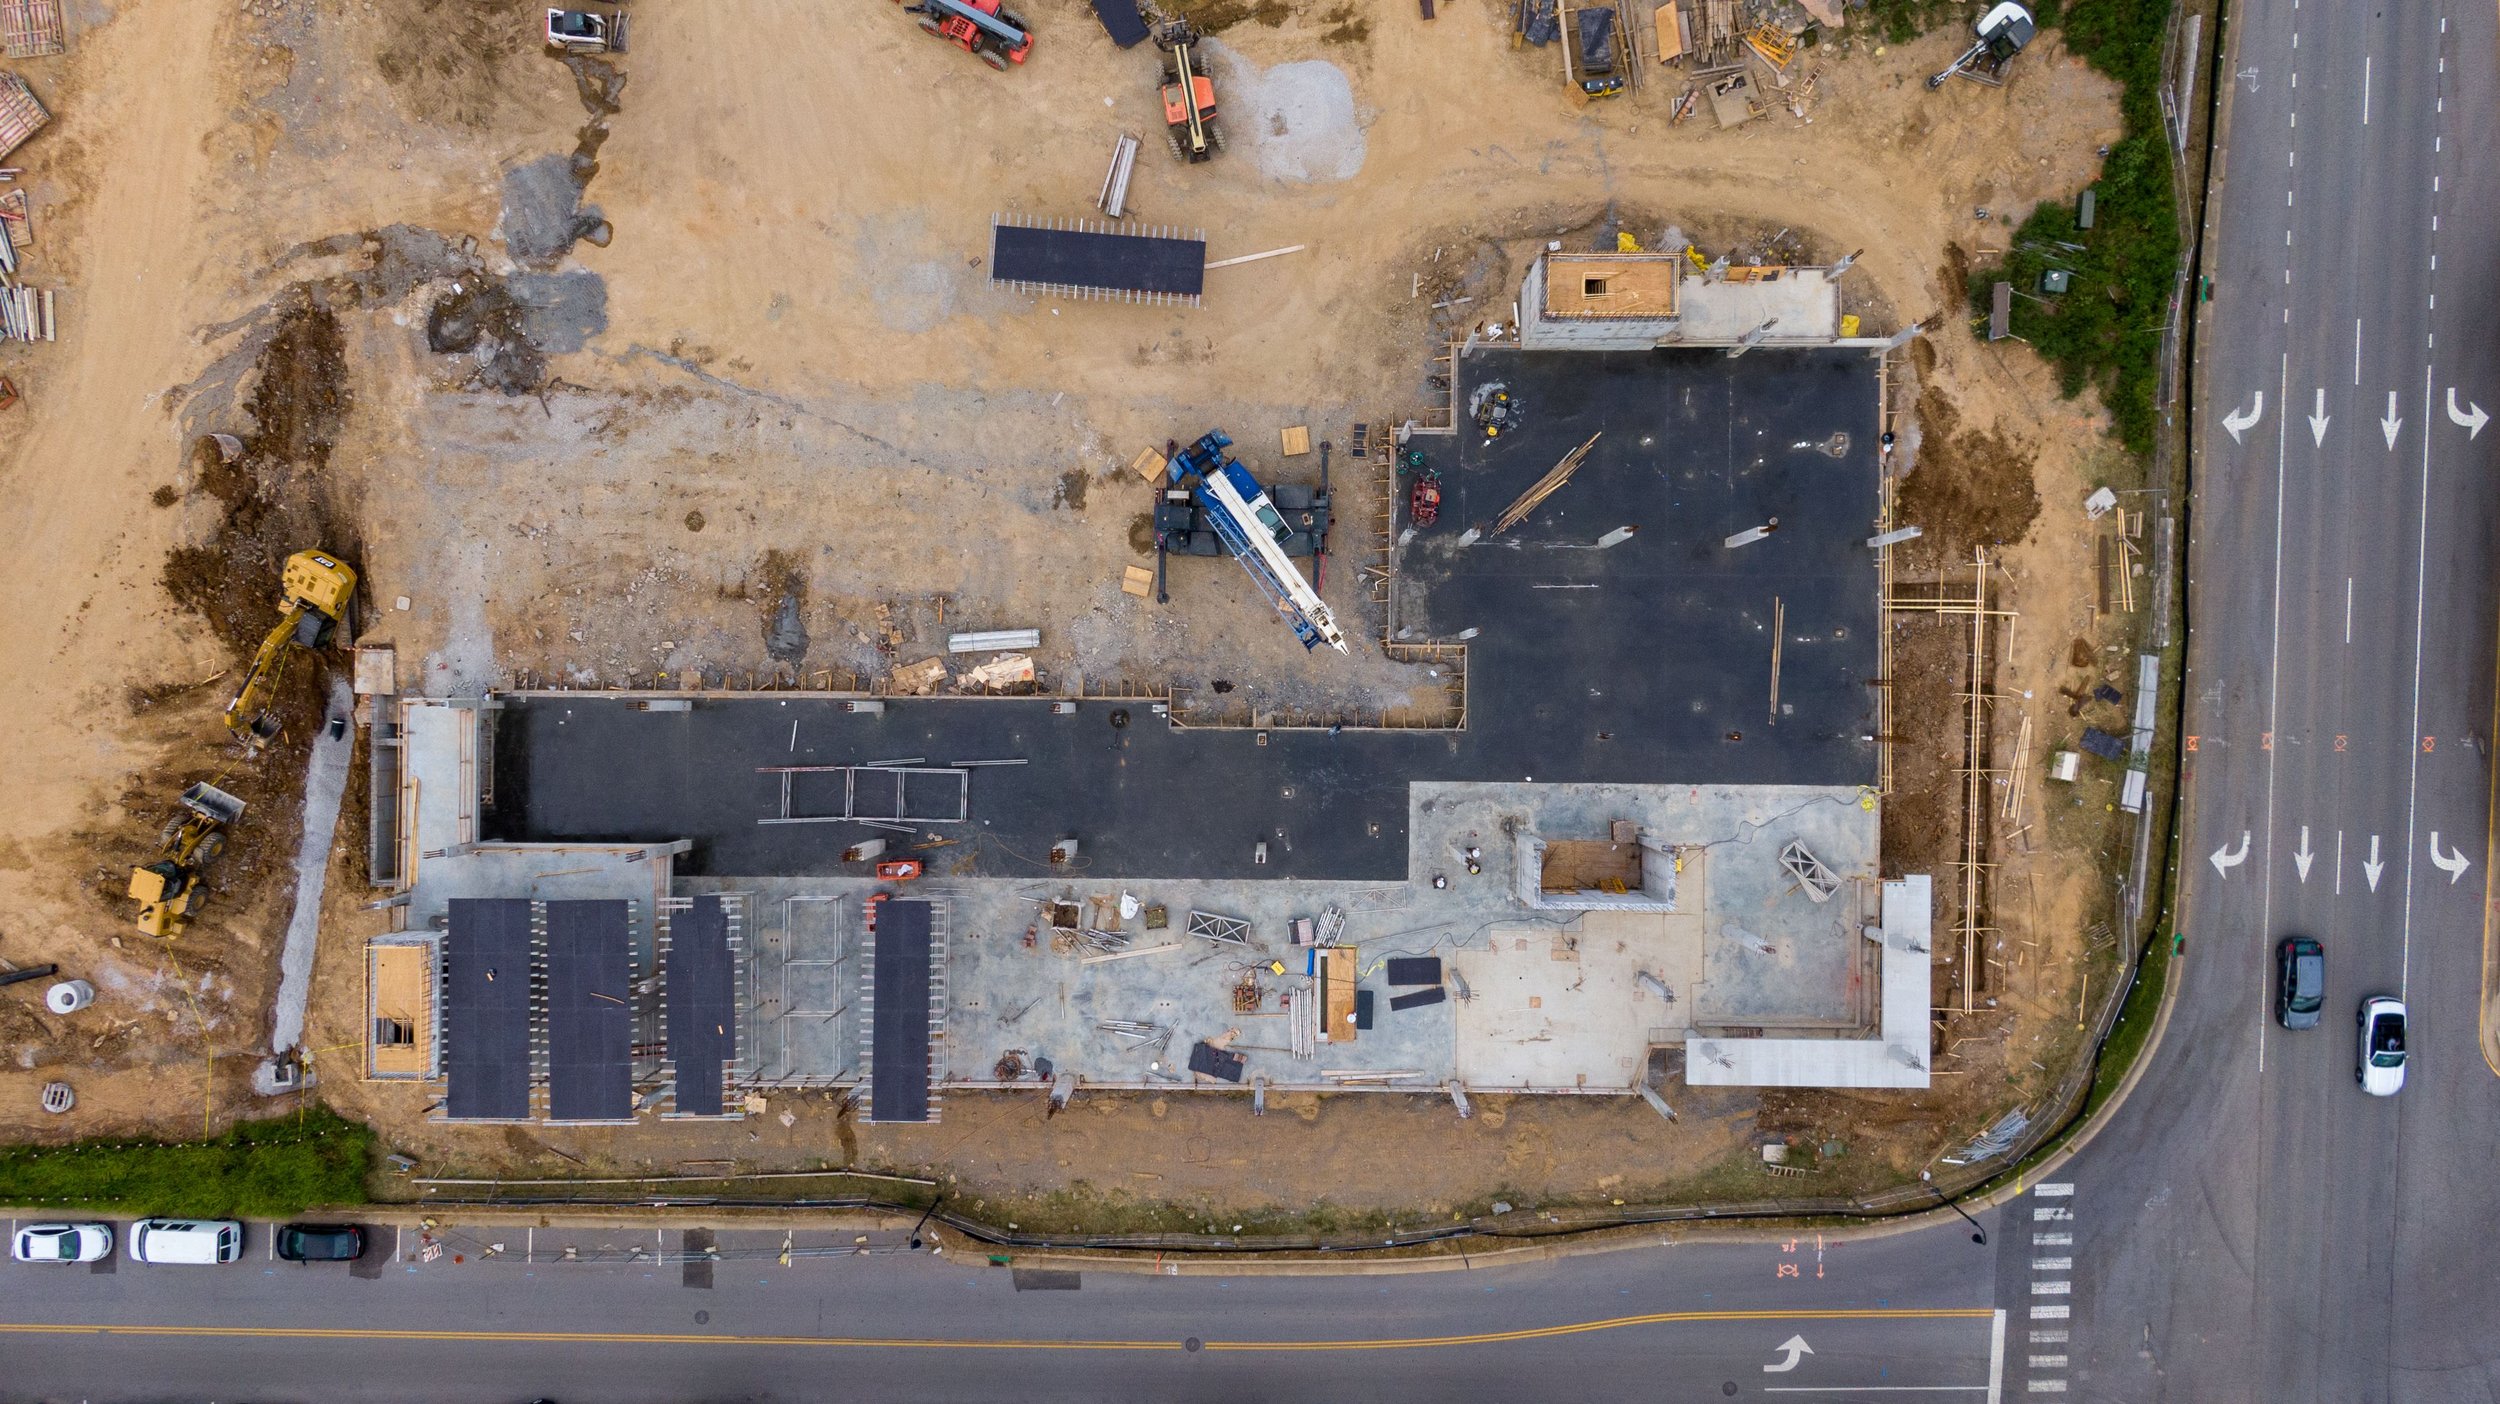
Construction sites can change quickly. Regular aerial and ground imagery gives your team a consistent visual record of that progress. We can return throughout the project to capture comparable views, making it easier to track changes, share updates, and reference previous site conditions.
COMMON USES
Progress updates
Site-condition records
Stakeholder communication
Before-and-after comparisons
Project portfollios
Marketing documentation
Service 02
Service 03
THERMAL & TECHNICAL DATA
Another layer of information.
Traditional photography shows what a site looks like. Thermal and technical imaging can provide additional information about conditions across a building, property, or project. When useful, we can combine this information with GIS and mapping to create clear visual deliverables.
COMMON USES
Thermal visualization
Environmental observation
Building and site documentation
Data visualization
Mapping and spatial analysis
Find roof, insulation, and air leaks

01 — Plan
We learn about your site, project, and what information you need.
Built arround your project

02 — capture
We collect the appropriate aerial, ground, thermal, or spatial data.

03 — Process
We organize the imagery and data into maps, visuals, media, or other project deliverables.
04 — deliver
You recieve clear, usable files that are easy to review, share, and understand.